


-
颅底肿瘤由于解剖部位的特殊性,手术切除困难,常规光子放疗因危及器官所限无法给予较高剂量,而脊索瘤和软骨肉瘤均属于常规放射抗拒肿瘤,从理论上而言,碳离子治疗对这类肿瘤具有独特的优势,因此其临床研究数据较为丰富。德国亥姆霍兹重离子研究中心GSI和日本国立放射学研究所(National Institute of Radiological Sciences, NIRS)在这类肿瘤治疗方面积累了大量的临床研究数据,相关研究报道碳离子治疗剂量为60~72 Gy,5年局控率可达70%~100%,且无严重毒副反应发生[1-3]。碳离子作为一种高传能线密度(Linear Energy Transfer, LET)射线,具有较高的电离密度和辐射损伤导致的高的DNA损伤率,常诱导DNA双链断裂损伤,很难通过修复机制修复,从而导致细胞较高的死亡率,因此与光子射线比较,其具有独特的辐射生物学优势;此外,由于碳离子独特的Bragg峰的剂量分布,能够将绝大部分辐射剂量沉积在肿瘤靶区,从而实现尽可能杀灭肿瘤的同时保护正常组织,因此,从理论上而言也具有独特的物理剂量学优势[4]。目前全世界的重离子治疗中心,主要使用两种束流配送技术,均匀扫描技术和笔形束扫描技术。笔形束扫描技术以其剂量配送的灵活而被认为是更先进的配送技术,可以实现调强粒子放疗。而均匀扫描是类似于光子适形放疗的一种技术,但是其计划的鲁棒性更优。本研究对7例颅底脊索瘤及1例颅底软骨肉瘤患者的碳离子均匀扫描计划与光子IMRT计划进行剂量学对比,以探讨重离子放疗相对于光子放疗的剂量学优势与特征。
-
纳入于2018年11月到2019年3月间武威HIMM注册临床试验期间治疗47例患者中的8例颅底恶性肿瘤患者,包括7例脊索瘤和1例软骨肉瘤,男7例,女1例,平均年龄(43±15)岁。所有患者均自愿参加验证碳离子治疗系统的安全性和有效性临床试验,并签署知情同意书。
-
患者取仰卧位,使用头颈肩热塑膜固定,德国Siemens CT 模拟定位机进行扫描。层间距为3 mm,扫描范围从颅顶上方2.0 cm到第四颈椎,重复扫描2次,平扫图像用于计划设计,增强扫描图像用于勾画靶区。将两种扫描方式的CT图像和MRI增强图像进行融合配准后,进行靶区勾画。
-
靶区定义主要参考了国际辐射单位和测量委员会(ICRU)第78、83号报告[5-6],在数据分析时,本文严格遵守ICRU第93号报告[7-9]对剂量报告方面的要求。肿瘤靶区(GTV)为增强CT及MRI影像可见的肿瘤范围,临床靶区(CTV)为GTV外扩5 mm范围,紧邻OAR处尽量减少外扩边界。考虑到颅内肿瘤几乎没有自主运动的特性,没有设置内靶区ITV。计划靶区PTV在CTV的基础上外扩,综合考虑治疗摆位的不确定度及束流射程的不确定度,位于束流入射方向近端和侧向均匀外扩3 mm,束流入射方向的远端的外扩遵循Paganetti[10]建议的公式WED×3.5%+2 mm,其中,WED为水等效深度。处方剂量,中国离子治疗指南(2020版),3.6~3.8 Gy(RBE)×16次=57.6~60.8 Gy(RBE)[2, 11-12],根据CTV和OAR的距离决定,距离较大时,处方剂量也大。
勾画的OAR包括双侧眼球、晶体、视神经、视交叉、脑干、颞叶、内耳。靶区和OAR勾画均由副主任医师以上职称的医生进行勾画,然后提交临床试验专家组审核通过。OAR剂量限制参考美国国立综合癌症网络(National Comprehensive Cancer Network, NCCN)临床实践指南中头颈肿瘤放射治疗原则[13]。
-
治疗设备为安装在武威的首套国产医用碳离子治疗系统(Heavy Ion Medical Machine-Wuwei, HIMM-WW),采用同步加速器,预留四个固定束治疗室,目前暂时启用两个治疗室。一号治疗室为一个水平固定束治疗头,提供笔形束扫描(Pencil Beam Scanning, PBS)的束流配送技术。二号治疗室为均匀扫描(Uniform Scanning, US)的束流配送技术,配备两个固定野治疗头,分别为0°和90°,提供5档能量的碳离子束,分别为120, 190, 260, 330, 400 MeV/u。束流从真空管道的引出窗引出后,依次经过两组正交的扫描磁铁、脊型过滤器、射程移位器、3组独立的MU检测电离室、2组检测束斑位置的分条电离室、MLC、补偿器,然后射入患者体内。而二号治疗室又可以选择将Bragg峰根据肿瘤深度一次性展宽的技术(Broad Beam Method, BBM),也可以选择使用能量层堆叠技术(Layer Stacking Method, LSM)。
-
每位患者实际治疗采用碳离子计划,另外按照同样的靶区和剂量限制要求设计光子治疗计划。碳离子治疗(Carbon Ion Radiotherapy, CIRT)计划系统为兰州科近泰基公司自主研发的ciPlan碳离子放疗计划系统(V1.0),该TPS使用笔形束剂量计算算法(PBC),RBE模型为二次线性模型(LQ model)[4]。可供选择的治疗头为0°和90°固定治疗头,考虑到0°射野无法避开晶体、垂体、视交叉等OAR,因此选择90°射野,并配合床角0°和180°实现两野对穿照射,或床角为0°和90°两野交角照射。所有患者没有使用LSM 技术,使用RF形成展宽的Bragg峰((Spread-out Bragg Peak, SOBP),选择适合的RF型号使得SOBP宽度适应靶区在纵向的尺寸。MLC从射束侧向适形靶区,补偿器调节SOBP的剂量下降区的深度,达到射束远端也能适形靶区。将碳离子计划的同一CT图像及Structure Set导入Varian公司的Eclipse计划系统(V13.5)设计逆向光子IMRT治疗计划,采用固定5 野技术,机架角为0°, 72°, 144°, 216°, 288°,处方剂量和碳离子治疗计划相一致, 要求95%的等剂量线覆盖CTV,90%的等剂量线覆盖PTV。所有计划均由两名副高及以上职称的放疗医师、一名计划设计物理师和一名副高以上物理师共同完成。
-
将两个计划的剂量文件导入MIM软件进行剂量对比。靶区比较参数为Dmax,Dmean,V95,HI,CI。适形度指数定义为[14]
其中:CTV95%代表95%的等剂量线所包绕的CTV的体积,CTV代表CTV的体积;V95%代表95%的等剂量线所包绕的所有组织的体积。其值越接近于1,则适形度越优。
均匀性指数定义为[6]
其中:
$ {D}_{2\text{%}}、{D}_{98\text{%}}、{D}_{50\text{%}} $ 分别代表靶区的近似最大剂量、近似最小剂量、中位剂量,定义为靶区中剂量由高到低的2%、50%、98%体积分别对应的剂量。HI的值越接近于零,则剂量越均匀。剂量体积直方图(Dose Volume Histogram, DVH)评估剂量学参数,包括靶区剂量和OAR,OAR剂量参数包括:脑干、垂体、视神经、视交叉、晶体、内耳的最大剂量(Dmax)和平均剂量(Dmean)。
-
采用SPSS 25.0软件进行数据分析,剂量绝对值、相对比值和剂量体积百分比采用配对t检验,相关分析采用Spearman法,显著性检验水平设为0.05,即P<0.05为差异有统计学意义。
-
该研究包括了8例颅底恶性肿瘤患者,表1详细列出了患者的临床特征、诊断和处方剂量。
患者 性别 年龄 RBE加权
剂量/Gy分次 单次RBE加
权剂量/Gy诊断 1 M 45 57.6 16 3.6 颅底脊索瘤 2 M 68 57.6 16 3.6 颅底脊索瘤 3 M 46 57.6 16 3.6 颅底脊索瘤 4 M 28 57.6 16 3.6 颅底软骨肉瘤 5 F 19 60.8* 16 3.8 颅底脊索瘤 6 M 54 57.6 16 3.6 颅底脊索瘤 7 M 34 57.6 16 3.6 颅底脊索瘤 8 M 50 57.6 16 3.6 颅底脊索瘤 * 病例5由于靶区远离重要危及器官,因此处方剂量略高。 -
图1所示为2例典型颅底肿瘤的CIRT和IMRT计划的横断面、冠状面和矢状面的剂量分布的比较,其中(a)为两野对穿照射的CIRT计划的剂量分布,(b)为两野交角照射的CIRT计划的剂量分布。统计学分析比较两张TPS计划PTV的V95、Dmean、CI和HI,结果显示V95二者之间无统计学差异,而Dmean、CI及HI均有统计学差异,且IMRT计划优于CIRT(表2)。
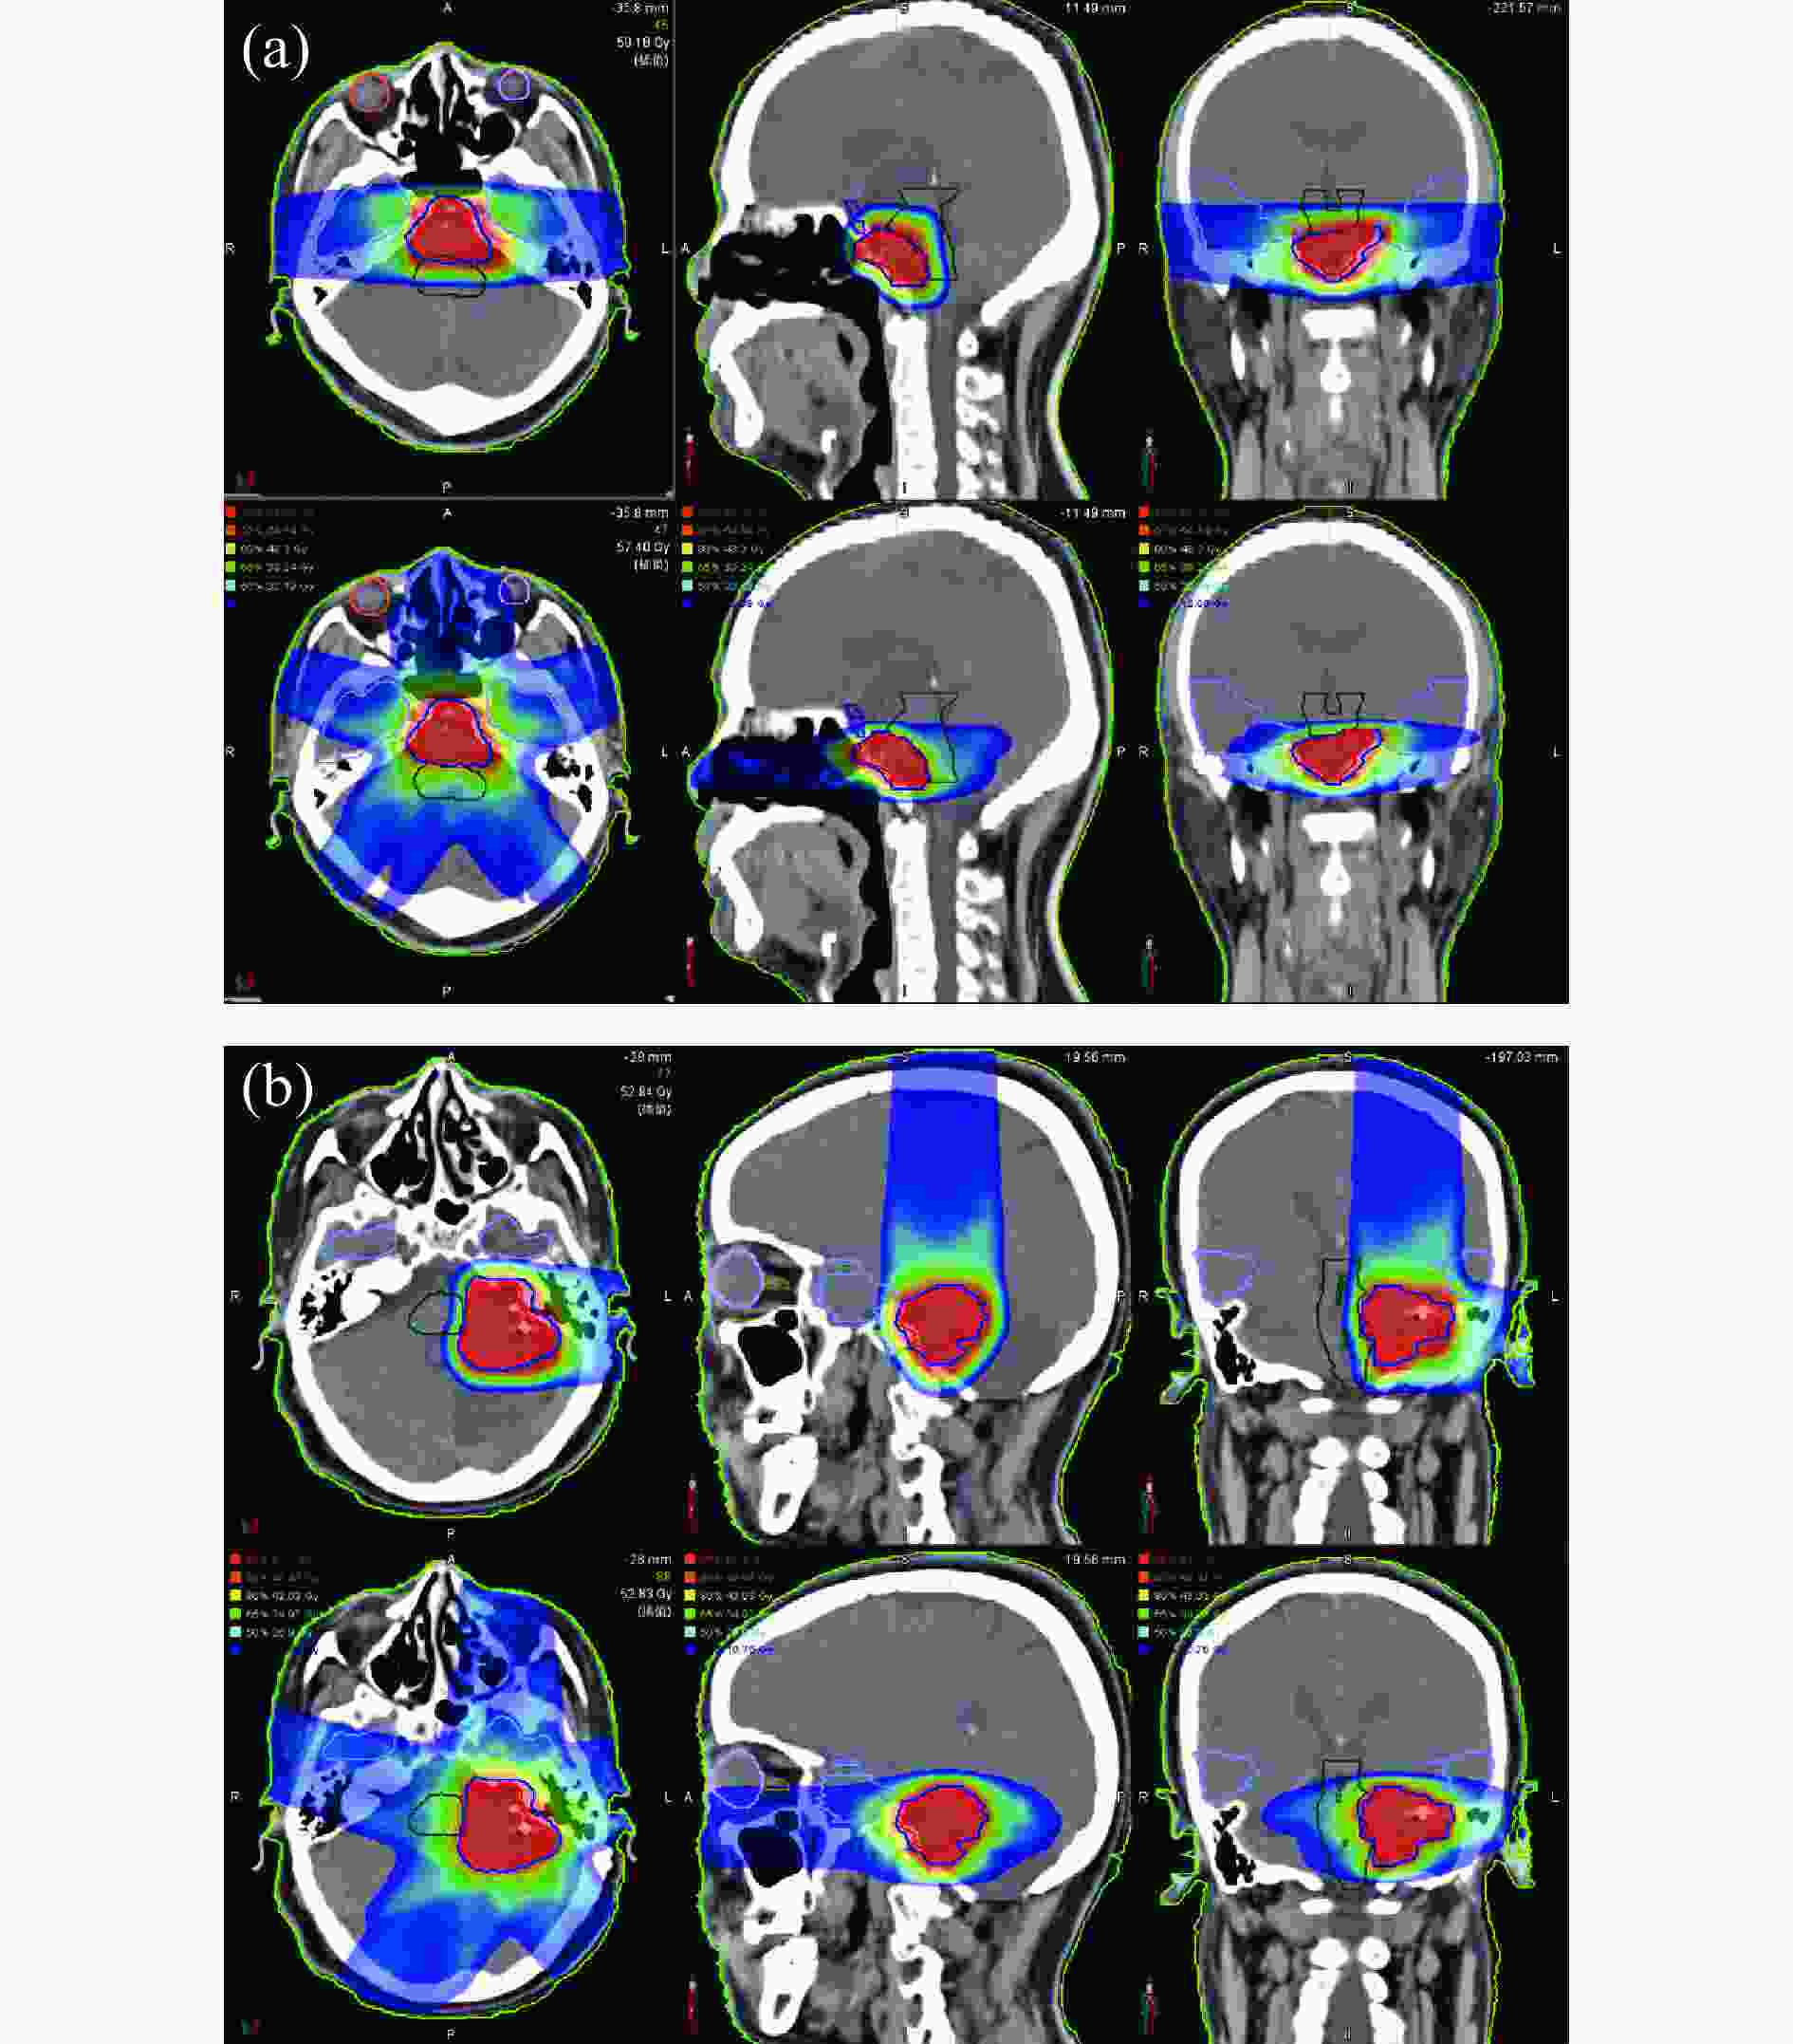
剂量学参数 CIRT IMRT P值 V95 91.060±10.630 98.060±1.150 0.106 Dmean 57.440±1.080 58.480±1.390 0.048 CI 0.359±0.174 0.202±0.032 0.031 HI 0.667±0.117 0.783±0.101 0.024 -
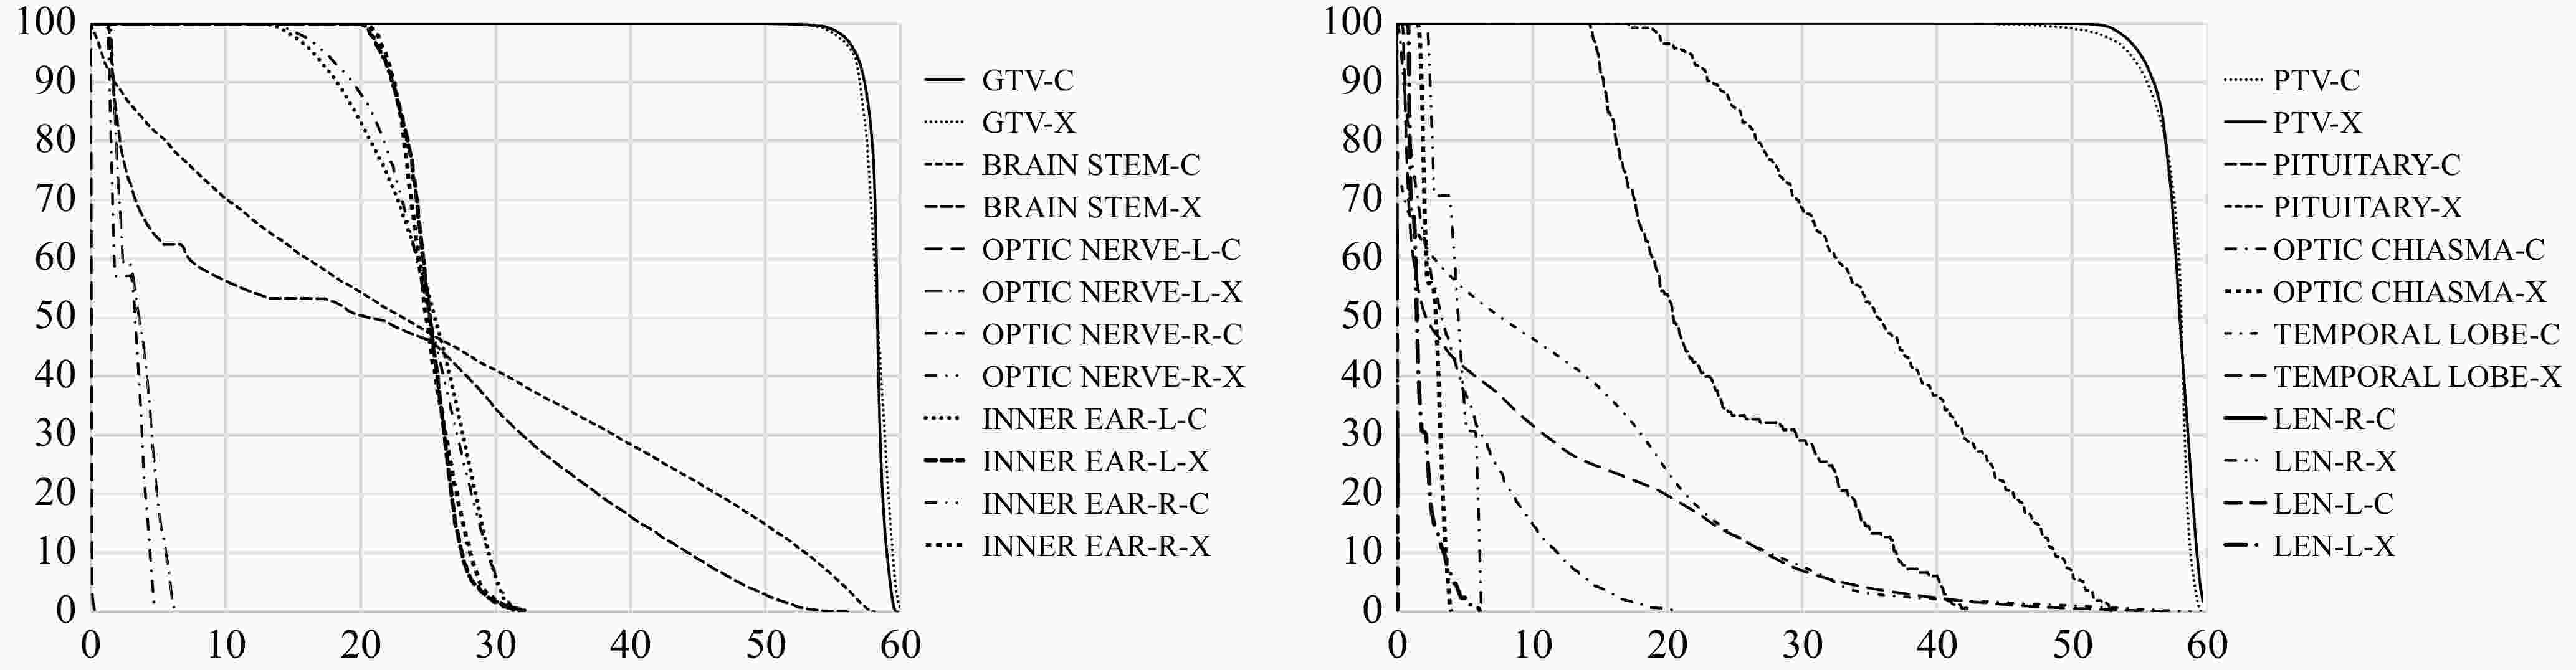
图2所示为1例典型病例的CIRT和IMRT的DVH比较,由于显示器官太多,为尽可能减少曲线之间的重叠,拆分为两个图展示。从图中可以看出,PTV、GTV的低剂量,IMRT计划更优,垂体、双侧视神经、双侧晶体的受照剂量CIRT计划更小。
-
对脑干、垂体、左右视神经、视交叉、左右颞叶、左右内耳9个器官的最大剂量Dmax和平均剂量Dmean以及左右晶体的最大剂量Dmax进行配对t检验,结果显示脑干Dmean、左侧视神经Dmean、左侧晶体Dmax、右侧晶体Dmax两组之间存在统计学差异,CIRT计划优于IMRT计划,而视交叉Dmax方面,IMRT优于CIRT(P<0.05)。其他的OAR剂量两组进行统计学比较,其均值CIRT均优于IMRT,但无统计学差异(表3)。
危及器官 剂量学参数 CIRT IMRT P值 脑干 Dmax 34.17±10.91 38.91±6.80 0.539 Dmean 48.27±4.80 53.19±3.33 0.008* 垂体 Dmax 11.77±6.68 22.69±5.32 0.748 Dmean 49.19±14.42 48.22±13.59 0.988 视交叉 Dmax 38.72±19.52 38.79±18.17 0.034* Dmean 40.10±20.03 30.93±22.68 0.066 左侧视神经 Dmax 31.68±23.40 25.64±23.31 0.632 Dmean 28.84±20.61 30.33±26.54 0.030* 右侧视神经 Dmax 8.87±8.94 14.06±10.67 0.878 Dmean 33.40±27.99 33.96±21.79 0.223 左晶体 Dmax 15.09±15.45 17.37±14.61 0.000* 右晶体 Dmax 0.06±0.18 6.54±0.66 0.047* 左侧颞叶 Dmax 2.29±6.47 6.72±2.23 0.723 Dmean 50.08±12.72 49.06±12.39 0.099 右侧颞叶 Dmax 8.00±5.39 12.32±6.63 0.250 Dmean 54.54±9.66 52.89±12.39 0.225 左侧内耳 Dmax 13.64±6.79 15.99±10.11 0.882 Dmean 34.79±20.38 34.31±15.11 0.711 右侧内耳 Dmax 21.78±13.54 23.15±10.27 0.438 Dmean 37.08±13.38 34.52±12.65 0.803 * P<0.05 -
最小Hausdroff距离[15]定义为空间上两个体积上距离最近的点的距离,如果这两个体积相交,则定义HDmin为0,HDmin的计算使用MIM软件(V6.9.6)进行。通过计算IMRT和CIRT计划的所有OAR的HDmin,并使用公式3拟合HDmin和OAR的最大受照剂量Dmax之间的关系,结果如表4和图3所示。
拟合参数 CIRT IMRT a 58.98±4.37 47.34±4.88 b −1.07±0.18 −1.14±0.33 c −0.00±4.05 6.67±4.25 SSE 4 245 6 328 R-square: 0.913 9 0.832 1 RMSE: 7.067 8.628 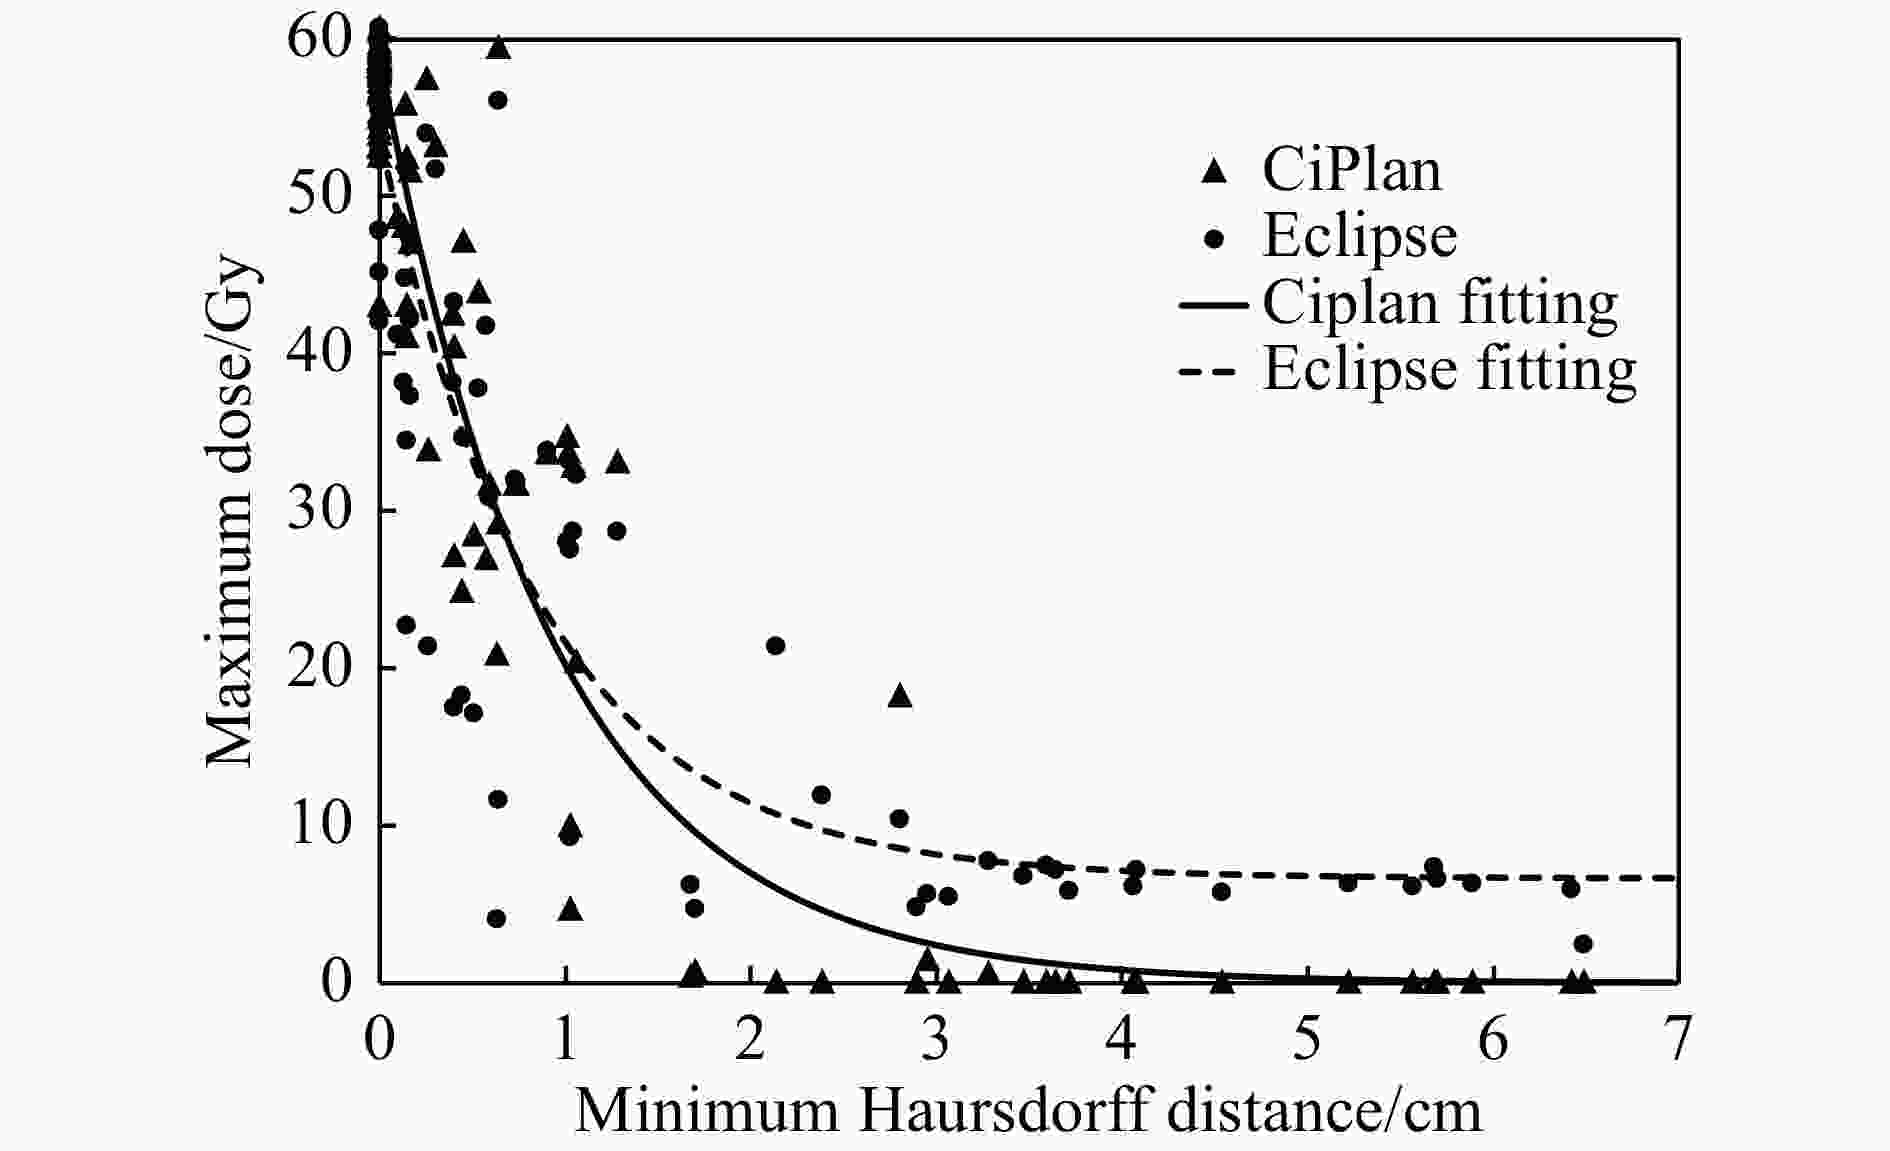
将表4中的拟合结果代入式(3)中,并令Dmax-CIRT=Dmax-IMRT,即为图3中两条曲线交叉点的纵坐标,得到HDmin为7.1 mm,即当OAR和PTV之间的最小距离大于7.1 mm时,CIRT计划的OAR受量要显著地小于IMRT计划。
-
手术及术后放疗仍为颅底脊索瘤和软骨肉瘤的主要治疗模式,然而常规光子放疗一直被认为效果欠佳。Pearlman和Friedman首次报道当肿瘤剂量大于65 Gy时,局部控制率(Local Control rate, LC)的提高与剂量-反应关系非常明显[16]。在一项术后光子图像引导的调强放疗的研究中[17],颅底脊索瘤和软骨肉瘤的剂量分别为76和70 Gy,5年总生存率(Overall Survival, OS)和LC分别为85.6%和65.3%,以及87.8%和88.1%。质子束由于其独特的物理学优势,使肿瘤靶区剂量增加成为可能,质子治疗(Proton Treatment, PT)对一些脑肿瘤和颅底肿瘤获得了很高的LC,一项质子治疗的研究长期随访结果显示,颅底脊索瘤和软骨肉瘤的中位总剂量分别为73.5和68.4 Gy,5年LC为81%和94%,而5年无病生存率(Disease Free Survival, DFS)分别为81%和100%,5年OS为62%和91%[18]。因此,质子治疗被认为是颅底脊索瘤和低级别软骨肉瘤患者的标准治疗[19]。
颅底肿瘤,因解剖复杂、毗邻重要OAR,对常规放疗提出了一定挑战,而CIRT由于其特有的物理学优势,从理论上具有一定的治疗优势[20]。 Mizoe等[21]报告了来自NIRS的三种治疗方案治疗颅底脊索瘤的临床结果,在60.8 Gy/15F/4w的剂量分割模式下, 5年LC为100%,无严重毒副反应发生。海德堡离子治疗中心HIT报告中位剂量为60 Gy/20F治疗的96例颅底脊索瘤患者,5年LC为70%,其中4.1%的患者发生晚期3级视神经病变,7.2%的患者发生颞叶损伤[2]。另外在术后行辅助CIRT治疗的9例患者中,7年OS为85.7%,3年无复发生存率(RFS)为70.0%[11]。对于颅底软骨肉瘤,在接受60 Gy剂量治疗后,中、低危组患者的3年LC分别为46.2%和98.8%,仅有1名患者发生3级急性粘膜炎,1名患者出现3级晚期毒性反应[3]。为了比较质子和碳离子疗法治疗低度颅底软骨肉瘤的临床效果,HIT开展了一项随机试验,比较了20份CIRT中的60 Gy和每份质子疗法中2 Gy的70 Gy[22]。
本研究表明,对于靶区的剂量分布,CIRT和IMRT技术都可以满足临床治疗的要求,但PTV的平均剂量、HI、CI等参数, CIRT计划劣于IMRT。这与我们CIRT所采用的均匀扫描照射技术有关。CIRT的均匀扫描方式,类似于光子放疗的三维适形照射(3D-CRT)技术,使用MLC适形靶区,对于凹形靶区的适形能力有限。另外,照射野的数量也影响靶区的适形度。虽然HIMM设备使用固定束,但治疗颅内及头颈部肿瘤时,可以使用水平束,通过旋转治疗床形成多个非共面射野来实现多射野治疗。如果增加射野数,从更多角度照射,利用MLC在射野侧向适形靶区,补偿器调节SOBP的下降区而在射野远端适形靶区,这样也许会改善靶区的CI指数,但相应地会提高OAR的受照射体积。脊型过滤器,用于调节SOBP,其设计是根据模体水的均匀密度来计算的,但实际治疗的患者,剂量沿深度方向的分布由于不同组织密度的差异,剂量均匀性会变差,影响HI的结果。另外,通过分析剂量分布,发现PTV边缘的剂量不足也是导致CIRT较IMRT HI较差的原因之一,其同样也会导致Dmean的下降。
OAR的受量方面,除垂体Dmean、视交叉Dmean、左侧视神经Dmax、左侧颞叶Dmean、左侧内耳Dmean、右侧内耳Dmean等6个OAR CIRT高于IMRT之外,余14个OAR 的剂量均显示为CIRT低于IMRT。放射治疗的一个原则是不能有OAR的受照剂量超过剂量限值,同时应尽量降低OAR的受照剂量。从对比的结果来看,所有的OAR的剂量都没有超过剂量限制,而从OAR的数量上来说,CIRT计划中有更多的OAR的剂量更低,因此说明CIRT计划在OAR受量方面优于IMRT计划。另外,从DVH上也可以看出CIRT计划的大多数OAR受照剂量小于IMRT计划的。对于头颈部肿瘤的OAR,多数以最大剂量作为其剂量限值,因此我们将所有OAR的Dmax汇总,分析最小Hausdroff距离HDmin和最大剂量Dmax之间的关系。从拟合曲线可以看出,在HDmin大于7.1 mm时,CIRT计划的OAR受量要显著的小于IMRT计划,而随着HDmin的增大,IMRT计划的OAR的Dmax逐渐变小,并趋于6.67 Gy, CIRT计划的OAR的Dmax也逐渐变小,并趋于0 Gy。该拟合公式的选择仅适用于本研究的数据拟合,对于其他部位的肿瘤,则需要根据数据分布规律重新选择拟合公式。
对于PBS和US的剂量特性,文献报道PBS的碳离子计划比光子IMRT计划明显有优势,不论是靶区剂量还是危及器官保护方面[23-25],但US碳离子治疗和光子治疗剂量对比的文献较少。Abe等[26]采用被动散射的CIRT和7野共面3D-CRT治疗肝癌的计划进行剂量对比,结果显示,靶区CI方面CIRT更优,但HI没有差别。Bradford等[27]对8例NSCLC患者的3D-CRT的SBRT计划和质子3D-CPT的SBRT计划进行剂量比较,结果显示,PTV的剂量覆盖质子治疗稍差于光子治疗。Takeshi等[28]对I期NSCLC的CIRT和光子SBRT计划进行比较,结果显示,CIRT的肺剂量优于SBRT,尤其对于靶区较大的肿瘤,但CIRT的靶区CI明显差于SBRT。Nicholas等[29]对10例儿童颅咽管瘤的3D-CPT、IMPT和IMRT进行剂量对比,结果显示,3D-CPT的靶区CI差于IMRT。由此可见粒子治疗的3D-CRT技术对比光子IMRT技术,在靶区CI或HI方面并不具有很大优势,这与本研究的结果基本一致。
本研究是基于国产重离子设备HIMM的剂量学对比研究,期望能够从剂量学角度分析比较均匀扫描方式的CIRT治疗和光子IMRT计划在颅底肿瘤治疗中的优劣,也期望了解国产碳离子治疗系统HIMM的剂量学性能。考虑对于颅底肿瘤计划,靶区体积较小且形状也较为规则,危及器官数较少,因此更多射野甚至容积旋转调强治疗(Volumetric Modulated Arc Therapy, VMAT)计划也不能带来剂量学上的优势。而射野数较少时,射野角度对危及器官的影响较大。但在临床中,对于颅底肿瘤的射野方向的选择并没有很大的自由度,由于晶体对射线的高度敏感,因此首要考虑射野方向是避开直射晶体,其次相邻射野角度尽量远离,由此可见本研究中的射野方向是最优的考虑。针对不同患者不同的靶区,射野角度可能会有很小的调整,这对OAR的剂量会有一些影响。对于CIRT计划,由于其单个射野就可实现靶区均匀的剂量分布,在临床治疗中为了提高效率,一般考虑应减少射野数量。由于较少的射野数量以及射程末端的剂量跌落,导致一部分OAR的最大剂量为0。而光子束不具备这样的剂量学特性,因此,即便OAR远离靶区4~7 cm时,仍有约处方剂量12%的受照剂量。
然而,本研究也存在一些缺陷,HIMM不仅支持均匀扫描US技术,而且还支持笔形束扫描PBS技术,PBS比US技术可提供更为灵活的剂量配送,使得靶区剂量分布更优、OAR保护更好,而本研究由于病例数有限,仅比较了US技术相对于光子IMRT的剂量学优劣,在今后的工作中我们将进一步对基于PBS技术的CIRT的剂量学特点做进一步研究。
综上所述,国产碳离子治疗系统HIMM基于均匀扫描模式治疗颅底肿瘤的CIRT计划相对于光子IMRT计划而言,在靶区均匀性、适形度和平均剂量方面略差于IMRT计划,但在毗邻危及器官的保护方面均优于IMRT计划,特别是当危及器官和靶区间距离大于7 mm时,CIRT计划要明显地优于IMRT计划。因此认为HIMM的均匀扫描治疗方式在颅底肿瘤CIRT治疗中,能够较光子IMRT更好地保护危及器官。然而以上剂量学优势仅从计划系统比较中获得,尚需临床实践中进一步检验。
Dosimetric Comparison Between Carbon-ion Uniform Scanning Mode Radiotherapy and Photon IMRT in the Malignant Skull Base Tumors
doi: 10.11804/NuclPhysRev.40.2022063
Funds:
Scientific and technological key research and development plan of Gansu province(20YF8FA116); Lanzhou talent innovation and entrepreneurship Project(2020-RC-113); Talent innovation and entrepreneurship project in Chengguan District of Lanzhou City(2020RCCX0033)
- Received Date: 2022-05-08
- Rev Recd Date: 2022-08-03
- Publish Date: 2023-06-20
-
Key words:
- skull base tumors /
- radiotherapy /
- ion radiotherapy /
- dosimetry
Abstract: Comparative analysis of the dosimetric differences between Chinese-produced heavy ion accelerator uniform scanning and photon intensity-modulated radiotherapy(IMRT) treatment plans in the treatment of skull base malignancies. A retrospective analysis of the treatment plans for 8 patients with skull base malignancies treated with the domestic heavy ion equipment (Heavy Ion Medical Machine, HIMM) using uniform scanning, including 7 chordoma and 1 chondrosarcoma. Carbon ion radiotherapy(CIRT) plans were designed using the ciPlan planning system (V1.0) from Lanzhou Kejintaiji Company, with a prescription dose of 57.6~60.8 Gy (RBE) in the planning target volume, delivered in 16 fractions of 3.6~3.8 Gy (RBE) per fraction. The treatment used a multi-leaf collimator(MLC) to adjust beam conformity, a ridge filter(RF) to spread-out the Bragg peak, and a bolus to adjust beam conformity at the distal end. A fixed horizontal nozzle was used at a couch angle of 0°, and the couch rotated 90° or 180° to achieve two-field intersecting or opposing fields. The photon IMRT plan used the Eclipse planning system (V13.5) from Varian company to design a fixed 5-field IMRT plan, with the same prescription dose as the CIRT plan. All plans were evaluated for dosimetric parameters based on organ-at-risk(OAR) dose limits, including target coverage, conformity index(CI), homogeneity index(HI), and OAR dose. There was no statistically significant difference in PTV V95 between the two plans (P=0.106), but Dmean, CI, and HI were statistically different, with the IMRT plan superior to the CIRT plan (P values of 0.048, 0.031, and 0.024, respectively). Regarding OAR dose, most OAR doses in the CIRT plan were smaller than those in the IMRT plan, but there was no statistically significant difference. However, the maximum dose to the optic chiasm, left and right lenses, and the mean dose to the brainstem and right optic nerve differed significantly between the two plans (P values of 0.034, 0.000, 0.047, 0.008, and 0.030, respectively). The distance between OAR and target volume was described using the minimum Hausdorff distance(HDmin), and when HDmin was greater than 7.1 mm, the CIRT plan was significantly superior to the IMRT plan. The uniform scanning CIRT was inferior to the photon IMRT plan in terms of target uniformity and conformity, but superior to the IMRT plan in terms of OAR dose. Whether the dosimetric advantages can be translated into clinical benefits remains to be further validated by clinical studies.
| Citation: | Zhiqiang LIU, Xiaoyun MA, Shilong SUN, Qiuning ZHANG, Ruifeng LIU, Hongtao LUO, Xiaoli LU, Xiaohu WANG. Dosimetric Comparison Between Carbon-ion Uniform Scanning Mode Radiotherapy and Photon IMRT in the Malignant Skull Base Tumors[J]. Nuclear Physics Review, 2023, 40(2): 287-293. doi: 10.11804/NuclPhysRev.40.2022063

|

 甘公网安备 62010202000723号
 DownLoad:

